
If you are currently on a team using Postgres as your primary database and using ORM, then there is a high chance that the developers miss out on some of the nuances of how Postgres executes the queries generated by the ORM and may end up discovering things in production. In this series, I will share a production incident followed by the learnings that led to Postgres internals, and finally what developers should be aware of from a Postgres point of view.
The production incident
One evening the production support team called me saying there is a continuous alert with “High CPU utilization on Postgres instance” and it had already reached a 100% when I started the investigation. During the investigation, I noticed these symptoms
- CPU Utilisation was 100%
- From Postgres logs, I figured out that there was one query that was called many times with different args and had higher latency(~800ms)
- System insights showed that there was a spike in CPU wait
- System insights showed that there was a spike in IO wait.
We took the query that was having high latency and ran “Explain analyze <<query>>” on that query and got to know it was doing a “seq scan” . But how does a seq scan cause High CPU utilization?
Let’s learn 3 Postgres internals
1. Everything is a file
Postgres stores all its objects like databases, tables, indexes as files on the disk. These files are binary and follow a special sequencing that only Postgres understands.
Let’s create a products database and a product table for an ecomm as below
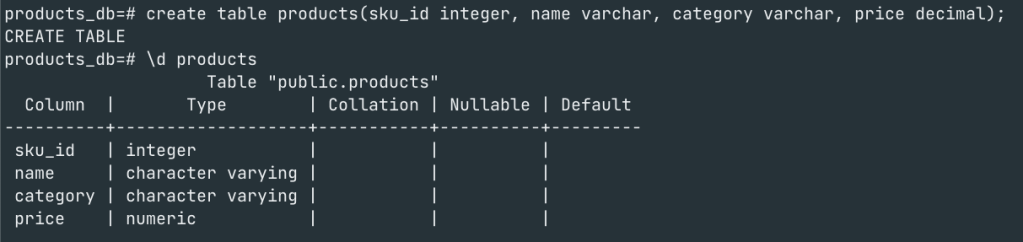
Once the database and tables are created we can check the files associated with database and the tables in the data directory of Postgres as shown below

With the Object identifier(oid) that Postgres creates for a resource, we can navigate to the Postgres data directory ($PGDATA/base) and see a folder with the same ‘oid’. If you aren’t sure on the location of data directory use “Show data_directory”

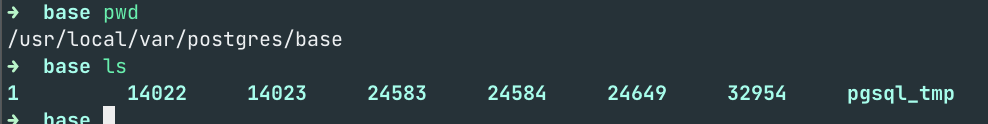
This folder is dedicated to this database and stores all files. Now let’s look at the ‘oid‘ for the ‘products’ table that we created and where the table is stored.

Please note that the products table(32955) is listed inside the products_db directory(32954).

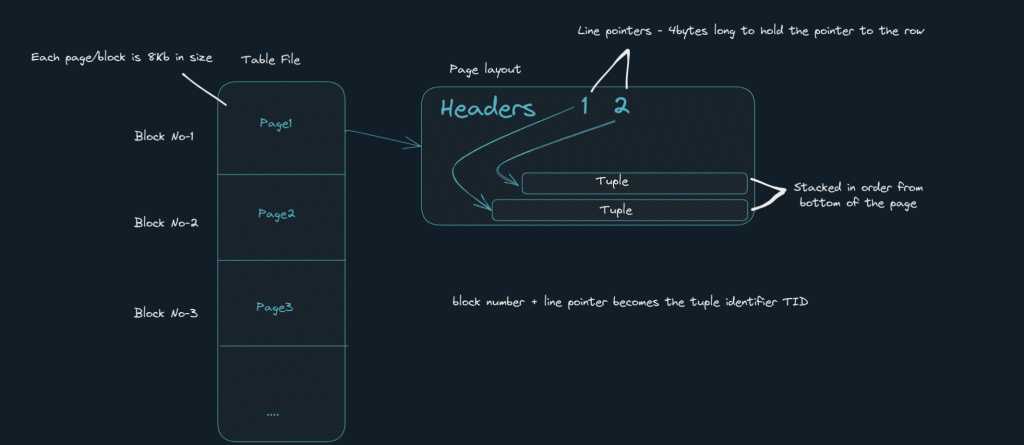
2. Files are logically split into Pages/blocks
Each file is a logical split into blocks/Pages which are 8KB in size . Each block has a bunch of headers and Tuples(row data). If you have a table with say 1000 rows with 3 columns, they could be stored across multiple pages within the file.
Let us seed 1 million rows for our ‘products’ table and use an extension to view the pages and tuples.
CREATE EXTENSION pageinspect;As you can see below, using the extension we can query for the no of tuples in say page 0 using ‘get_raw_page(<<tablename>>, pageno) and also view how one tuple(row) in that table looks like.

Lets analyse the query using “EXPLAIN ANALYSE”.
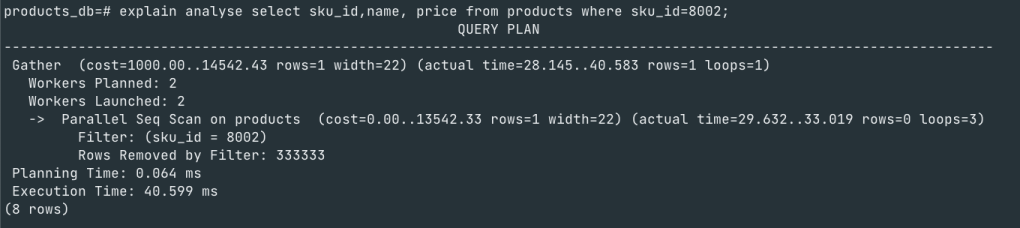
Things to note here is that when you execute a query using “EXPLAIN ANALYSE” Postgres shows the query plan that it will use to execute the query. Developers should be watchful of the type of scan Postgres is using for the query and execution time. If it is using a “Seq scan” as in this example, then it is a cause for concern because of the following reasons
When we execute a “Select” query that is using Seq scan, Postgres reads the whole file page by page from disk to memory and scan it sequentially.
There are 2 things to note here
- Loading 10 pages from disk to memory for each client/query execution for different conditions(*if that page isn’t in ‘shared buffer’)
- The time that is spent sequentially scanning all rows on all pages once it is in memory.
The first point above directly relates to CPU wait due to IO wait as the CPU is waiting for Postgres to load all pages into memory from disk before it can execute the query.
So the lesson to learn here is that “Seq scan” are very expensive and could result in multiple issues ranging from high CPU utilization to slow query which has a cascading effect on the application.
3. Postgres executes everything in memory
Yes, Whether it is a read or write query postgres loads the page from disk into ‘Shared buffer’ and performs read/write in memory. For writes, the same technique is followed where the page is loaded into memory and tuples are inserted/delete/updated into the page and through a seperate process called ‘Checkpoint’ it flushes the pages back to the disk.
Index Scan
Well, we know that creating an “index”on the column in ‘where’ clause will make the query faster as Postgres will do index scan instead of “seq scan”. But what happens in an index scan??
Here is the Magic, lets see

Indexes are stored as a files and they look like this

As you see postgres loads the index file into memory and fetches only the pages that match the condition ‘sku=8002’. In this case it just loads 1 page – ‘page no – 200’ and uses the offset to get to the data and hence the high difference in execution time.
Note: There is one situation where Postgres will still go with a “seq scan” even if you have explicitly created an index on a column. Curious? search and try it out.
From a Developer’s lens
To conclude, Below is the checklist developers can use to better design and avoid production incidents and performance bottlenecks that could happen at a later stage.
Analysis phase
Understand the requirements from DB point of view
- Are the queries required – read heavy or write heavy?
- What are the read query patterns
- Identify indexes based on this – btree/Grin/Gin index
- What are write query patterns? Is is concurrency safe?
- What transition isolation level should be used for this use-case – Read committed or Serializable?
- Should we use optimistic locking or pessimistic locking?
Build phase
- If using ORM, log queries to console during development phase in debug mode and do explain analyse on them to understand the time takes and scan it is using
- Always use “Explain analyze <<query>>” to understand which type of scan Postgres is using – seq scan vs index scans
- Keep the transaction short. Configure Transaction timeout as necessary
- Identify the data type that is most suitable for the query pattern required – JSON, primitives, date range
- Enable Slow query logs in Postgres configuration “log_min_duration_statement“
Run phase
- Monitor these metrics
- TPS
- Active Connections
- Locks
- DiskIO
- Long- running queries
- CPU Utilization
- Memory Utilization
- CPU wait/IO wait
- Index size vs RAM Size – Always configure memory to be total index size + 1-2 GB buffer.
- Archive data, vacuum, and re-index periodically.

Leave a comment